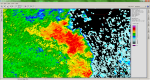
My favorite hook echo image this year from the 6/26 storm that impacted Adams, Highland, Scioto, and Pike Counties. Despite its impressive appearance, it did not produce any tornadoes.
I have compiled a gallery of radar imagery from each tornado warned storm (as well as those unwarned storms that resulted in tornadoes) in Ohio in 2015. There were a wide variety of different radar signatures; some of which allow one to easily identify where the rotation may be, others make the job nearly impossible, even with the aid of velocity imagery. In order to compile these, I used the Iowa Cow website to look up tornado warning and LSR dates and times, and then downloaded radar image files from the National Climate Data Center (NCDC) and viewed them using the Weather Climate Toolkit, which is free to download from the NCDC. I will later add in a page including more detailed radar imagery for each of the seven confirmed Ohio tornadoes this year.
As has been customary over the past few years, yesterday we saw a Christmastime severe weather system roll through the Ohio valley, bringing with it several tornado warnings in southwestern Ohio. Counties including Brown, Clermont, Darke, Miami, Preble, and Shelby all received tornado warnings, and this was the first time that Shelby and Preble counties had a tornado warning issued this year. This afternoon the National Weather Service office in Wilmington, Ohio confirmed a tornado occurred near Arcanum in Darke County, Ohio during yesterday’s storms. It was given an EF0 rating with winds of 77mph. According to the NWS, it was 20 yards wide and traveled along a 50 yard path.
This is the first time a tornado warning has been issued in Ohio since the storms on August 10th. To date we have had 7 confirmed tornadoes, which is a lot fewer than the 19 we had last year. Hopefully we will end our year with no further severe weather in Ohio. Merry Christmas everyone!
* The confirmed tornado in Green County occurred with neither a severe thunderstorm warning, nor a tornado warning.
** The confirmed tornado in Washington County occurred with neither a severe thunderstorm warning nor a tornado warning. The two warnings that were issued for Washington County were issued during storms that occurred on April 9th.
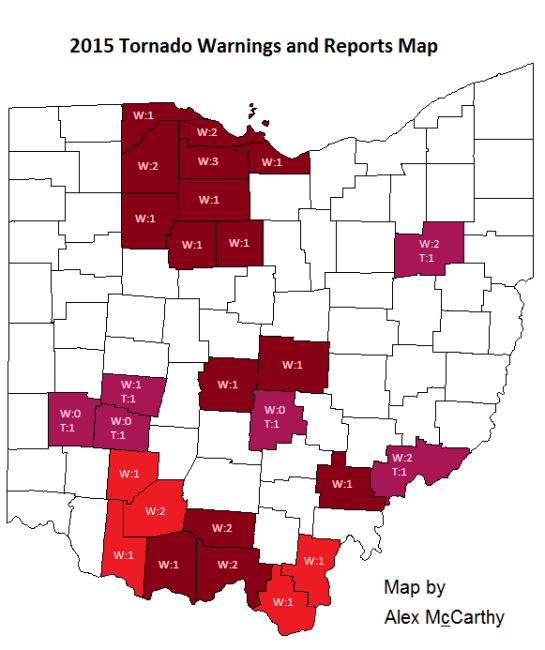
*** This map is made to highlight Ohio counties that have had tornado warnings issued and counties that have had confirmed tornado touchdowns in the 2015 calendar year. Shades of red indicate counties that have had tornado warnings yet have had no confirmed tornado touchdowns yet. Shades of purple indicate counties that have had confirmed tornado touchdowns. In both cases, the bright colors indicate the newest add-ons to this map and are usually the counties mentioned in the discussion above. Darker shades, on the other hand, are used for counties that have had no change in their 2015 tornado statistics. As a second feature, counties that have experienced warnings or touchdowns also have numbers coinciding to the number of tornado warnings and touchdowns. The number that follows a “W” is the number of warnings the county has received, and the number that follows the “T” is the number of confirmed touchdowns that there have been. It is important to remember that each warning issued is counted. If there is a tornado warning on a storm in Stark county, and a second warning is issued for Stark on the same storm, then Stark county would be considered to have two warnings despite there only being one tornadic storm. Likewise, if a single storm drops numerous tornadoes, each tornado will be counted as an individual tornado.
Generally speaking, the weather begins to calm down once we hit mid-July here in Ohio, and that has been the trend this summer. We have gone almost a month since the last tornado warning was issued, and this is typical. Last August, on August 12th to be exact, an unwarned storm dropped an EF0 tornado in Johnstown, Ohio, located in Licking County, that was confirmed due to surveillance footage from a nearby convenience store. Almost a year later, another storm went through Licking County, and as coincidence would suggest, prompted a tornado warning for Johnstown and areas southeast.
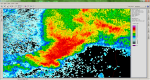
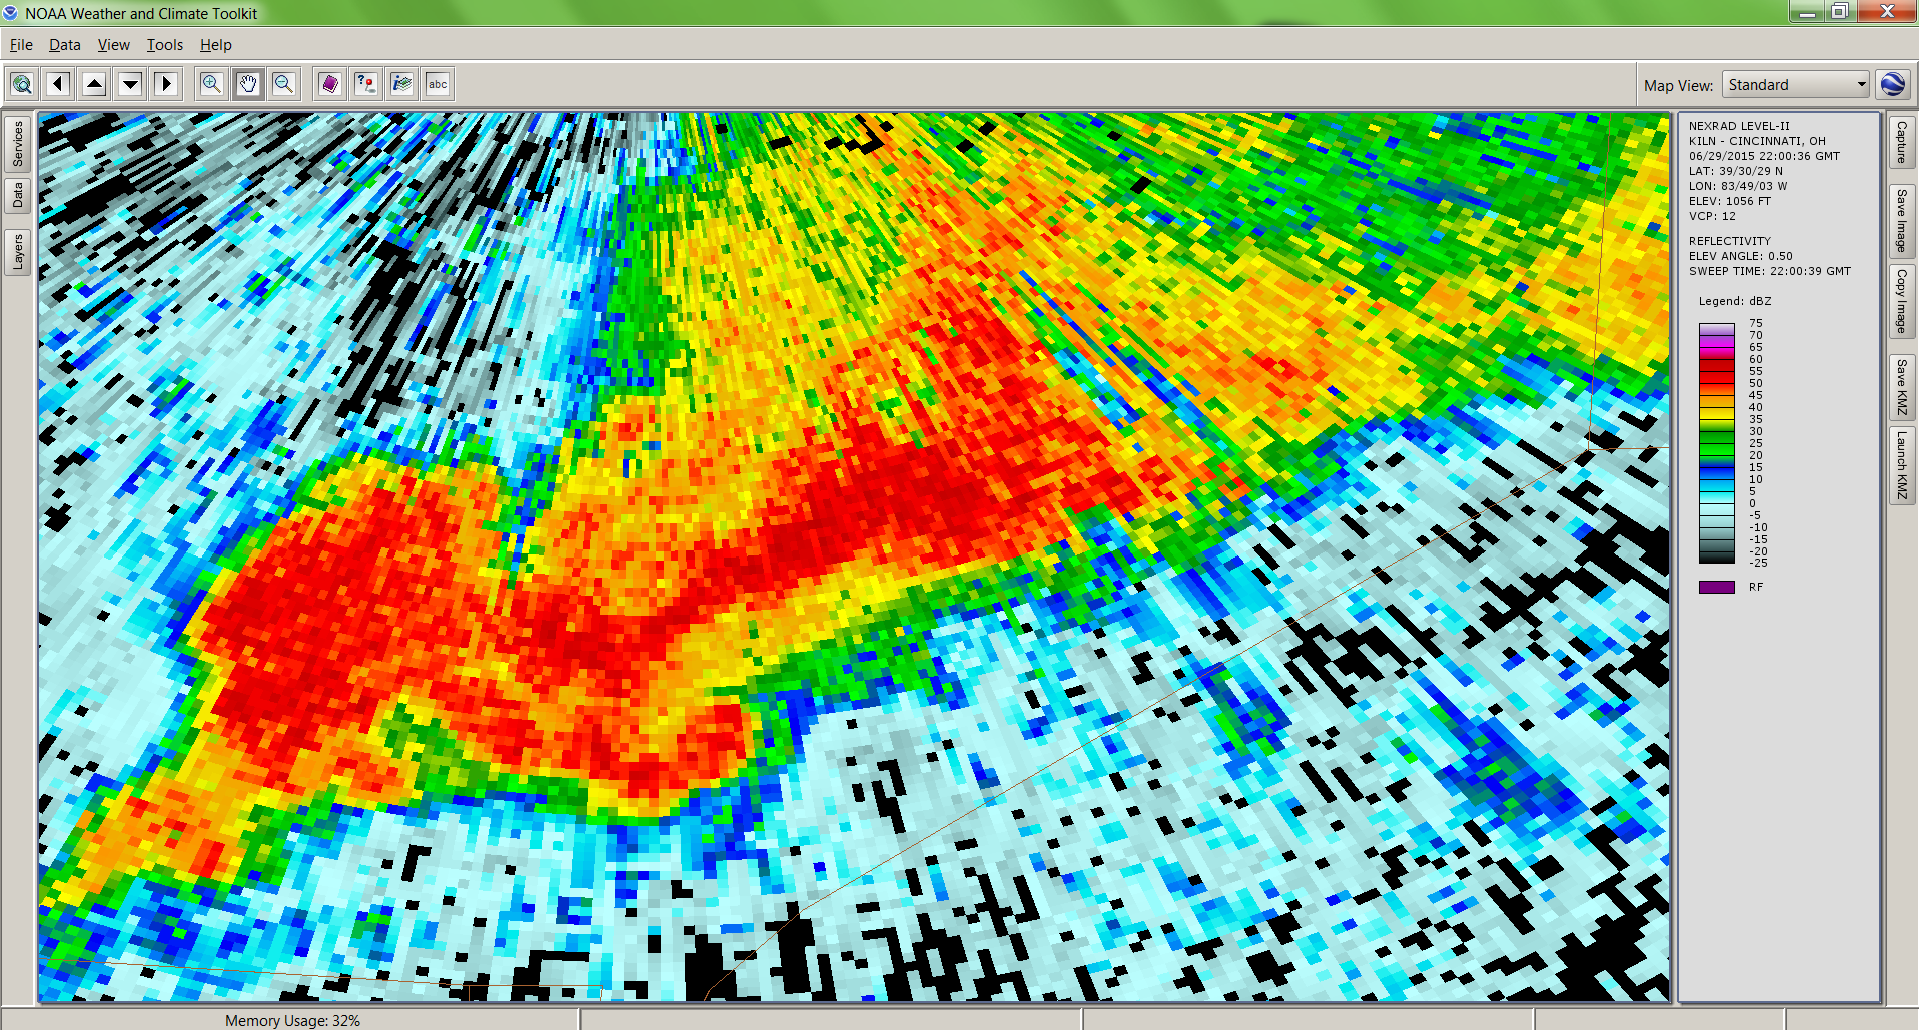
I have attached images of the reflectivity and storm-relative velocity to show where the rotation was, but it is rather broad:
Storm Base Reflectivity at 1:42 pm (ILN)
Storm Base Velocity at 1:42pm (ILN)
From the reflectivity alone it is difficult to see what is going on. There is a pretty clear rear inflow notch (RIN), but there are several indents along the forward flank that could be forward inflow notches (FIN). I have drawn in an arrow to designate what I feel was the strongest of these FIN’s based on looking at the storm relative velocity data. If you look, there is a linear stretch of gray pixels along where the FIN that I point to is. Remember that since air moving into the storm at this FIN is moving almost perfectly perpendicular to the radar beam (KILN), the beam does not pick up a high velocity and instead shows this stretch of low velocity air moving into the storm. The rotation itself occurs in the region of the storm between the RIN and FIN.
Though the above rotation is weak, while watching the storm on GRLevel3 yesterday, it appeared that there was some stronger rotation from the Port Columbus International Airport (KCMH), but that radar data will not be available on the NCDC data archive for a few more days. In the end, no tornado was associated with this storm.
Now that we are approaching Autumn, things will most likely continue to stay quiet in Ohio. There is usually one or two severe weather outbreaks between September and October, and the typical mid-November outbreak that tends to impact Illinois, Indiana, and occasionally Ohio, but until then, this map will most likely remain stagnant.
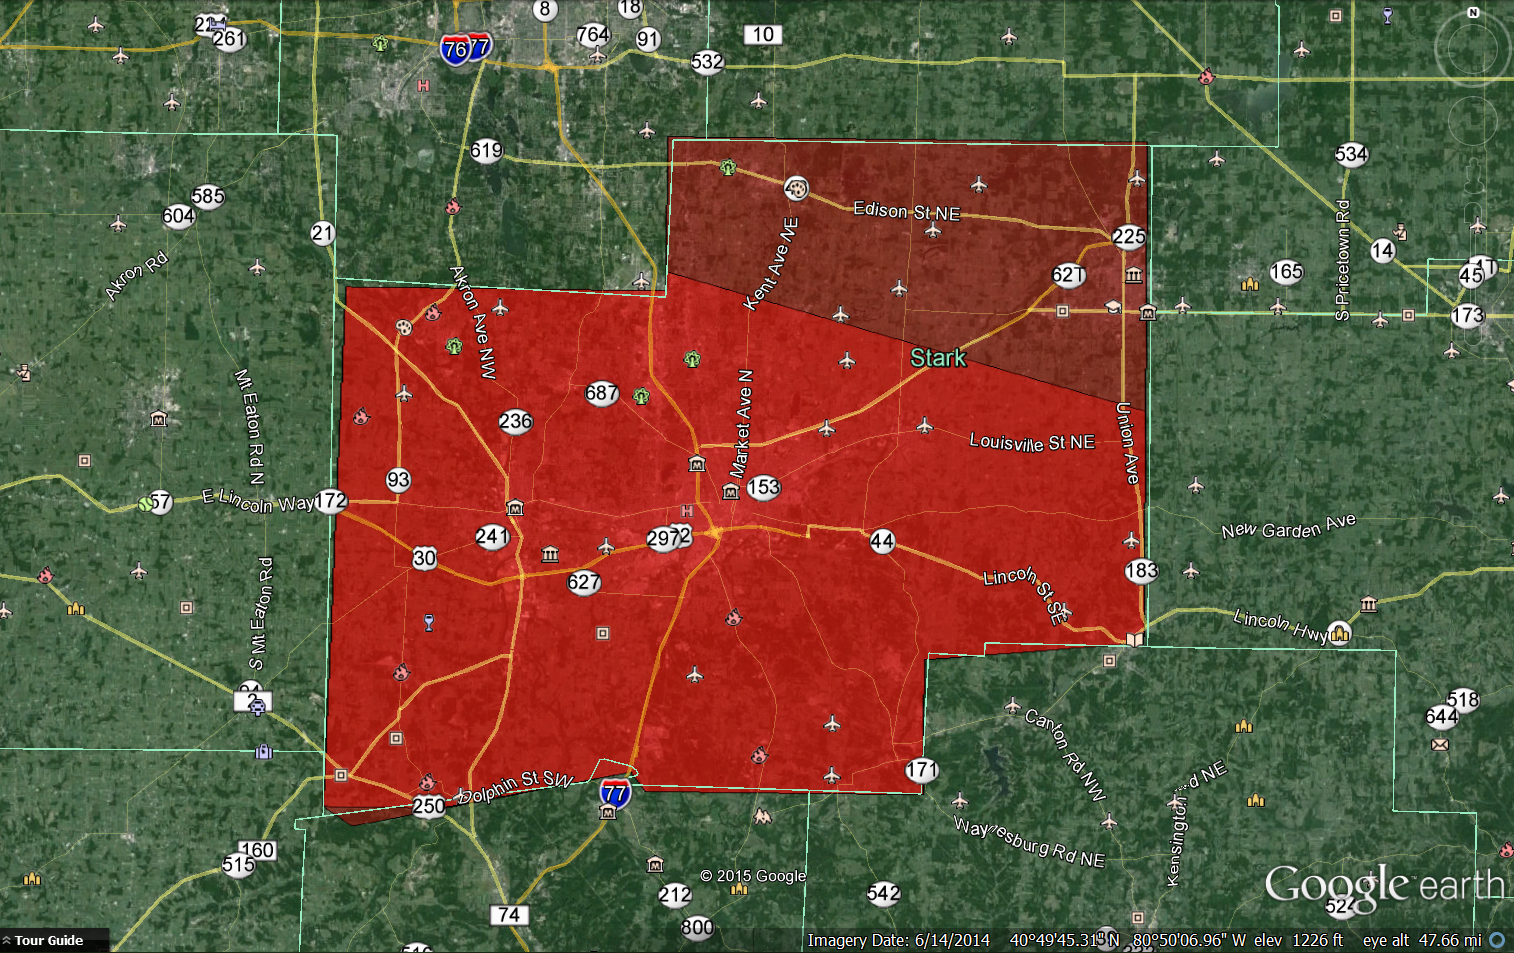
This image is comprised of two .kml files uploaded to Google Earth that are associated with the two tornado warnings issued for the storm on June 18th. The first tornado warning, issued at 7:09pm, is displayed as the bright red polygon. When the second warning, corresponding to the Uniontown/Hartville tornado, was issued at 7:15pm, the warning polygon encompassed the whole county; both the dark red and bright red regions above.
Though Stark County, located in northeastern Ohio, generally receives a few tornado warnings each year, there has not been a confirmed tornado touchdown within county lines since August 9th, 2007. In that storm system, which is very similar to the one from last week that I am about to discuss, microvorticies along a strengthening bow echo produced a weak EF0 tornado in Massillon, Ohio, just a few miles away from Uniontown.
In similar fashion, last month a strengthening bow echo moved through the area, and two microvorticies in particular were watched closely by the National Weather Service in Cleveland, Ohio. Both of these, which will be discussed in greater detail soon, resulted in a tornado warning, and the NWS later confirmed an EF1 tornado had been produced by the northernmost of these microvortices, touching down between Uniontown and Hartville, Ohio. This tornado ripped apart trees and damaged the roofs of several houses and barns along a nine mile long path. Using data from the National Climatic Data Center (NCDC), I have posted some images below of the resulting reflectivities and velocities as the storm progressed through the county.
6:55pm
Storm Base Reflectivity at 6:55pm
Storm Base Velocity at 6:55pm
The first severe damage that this storm caused was witnessed in Summit County, not too far from the Portage Lakes area. Looking at the radar imagery from 22:55 UTC (6:55pm EST), there is a nice appendage near where the damage appeared, but any rotation is broad. There is, however, a strong pocket of wind in excess of 70kts at the lowest sampling level, and the NWS attributed the damage to straight line winds.
7:05pm
Storm Base Reflectivity 7:05pm
Storm Base Velocity 7:05pm
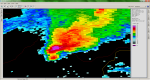
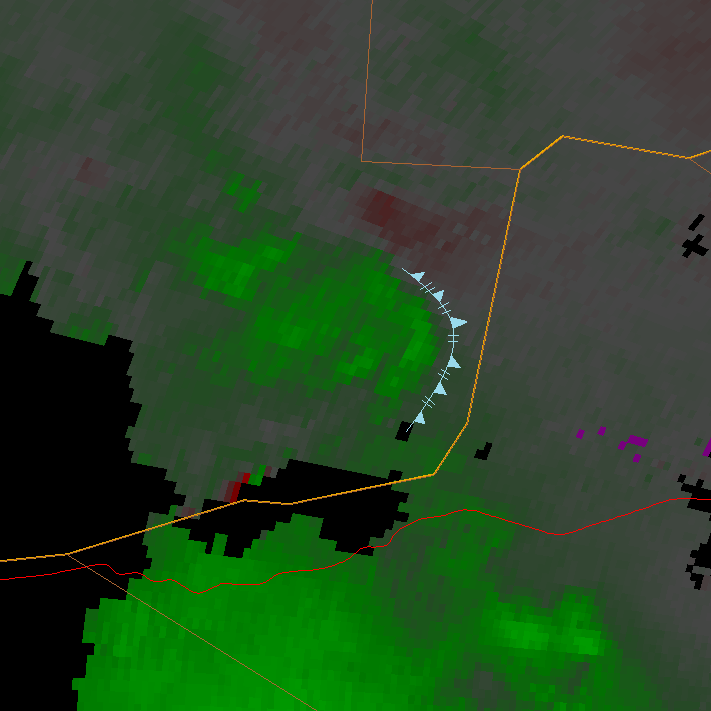
Within about ten minutes, the storm moved into stark county. In the reflectivity image, it is clear that there is a hook echo entering extreme northwestern Stark County. Though the rotation is not very intense, the National Weather Service office in Cleveland, Ohio issued a tornado warning. This pocket of rotation was not the only region of the storm where damaging winds were a threat, for the storm began to bow out just east of the rotating microvortex. In the velocity image, I have circled the microvortex (it is not as deep or strong as a mesocyclone should be) and have outlined the gust front at the leading edge of the bowing section. Furthermore, I was able to capture a nice video of the arcus cloud associated with this gust front and have embedded this video here too.
I previously described the appendage in Summit county that had caused some damage around Portage Lakes. This appendage had weakened since the radar loop ten minutes earlier, and was now overshadowed by the hook echo in western Stark county, but this is the appendage that would go on to become tornadic in a short while.
7:10pm
Storm Reflectivity 7:10pm
Storm Base Velocity 7:10pm
By the next radar loop, the hook echo in northwestern Stark County began to weaken, but the appendage now in northern Stark County began to form a well-defined hook echo. By now it is getting ready to move into Uniontown, Ohio where it will drop a tornado between this radar loop and the next one. I first want to address the bright green patch that can be seen in the storm base velocity image. You always hear meteorologists on TV talk about “the bright reds and greens right next to each other” and how that indicates the presence of strong rotation within the storm. Here, it appears as though there is a large swatch of bright green right beside a lot of bright red, which may lead one to think that there is strong rotation here. This is deceiving, however, for that bright green is an error in the radar’s sampling of wind velocities. In this case the winds that are being sampled by the radar are moving so quickly that they do not correspond to any of the colors on the red pallet and therefore are displayed as bright green.It is not, however indicative of strong rotation. Instead, just to the east of the red “hook” of velocities moving away from the radar, there is a patch of gray with some dull green colors in it. This gray and dark green alongside the bright reds is where the rotation is. At first this may not make sense. If winds are that weak, could a tornado really do much damage? The key here is that the storm is moving away from the radar as the radar samples this, and since this image is not storm-relative velocity, the apparent velocity of the inflow winds is much smaller than what it actually is. All this considered, the rotation at this point it is still weak, but the NWS still issued a warning on it.
The other hook echo, located in northwestern Stark County, has weakened by now, as previously mentioned. Some members of Stark County Skywarn reported seeing a wall cloud, but I don’t know if it was reported to have been rotating or not. To my knowledge there was no funnel cloud reported with that hook.
7:15pm
Storm Base Reflectivity 7:!5pm
Storm Base Velocity 7:15pm
Though the tornado warning in western Stark County remained in effect, the hook echo had essentially dissipated. An appendage was still visible, but there was no notable rotation or strong winds. The hook echo in northern Stark County, however, was in full force. There was currently an EF1 tornado striking along a path between Uniontown and Hartville.
7:19pm
Storm Base Reflectivity 7:19pm
Storm Base Velocity 7:19pm
This is when the hook echo is most impressive in my opinion, for the reflectivity shows a very nice hook appendage. This is also when the microvortex appears the most well defined amongst the base velocity images. Nevertheless, the rear-flank downdraft (RFD) is beginning to intensify, which will soon kill microvortex. Furthermore, the storm as a whole will soon begin to bow out, which will help the RFD kill the microvortex.
7:24pm
Storm Base Reflectivity 7:24pm
Storm Base Velocity 7:24pm
By now the tornado is no longer on the ground. The RFD is producing strong surface winds that would cut off any circulation attempting to reach the ground. This RFD is producing a new gust front, which is manifesting itself quite well in both the reflectivity and velocity images. Though the hook echo persists for a few more minutes, it does not produce any more tornadoes. Not visible until the next radar loop is a rear inflow jet that will help this complex evolve into a nice bow echo. As the rear inflow jet intensifies, the storm would soon begin to bow out and quickly move straight for Pennsylvania, producing damaging straight-line winds as it moves along.
Another round of severe weather swept through the Ohio Valley yesterday, resulting in another tornado warning that encompassed Brown and Clermont counties. Recall that Clermont County received a tornado warning last Monday, though it has been about a month since Brown Count received its last tornado warning on June 29th. There was no confirmed tornado with this storm.
Below is an image of storm base reflectivity and storm base velocity taken from KILN (NWS Wilmington’s radar) just prior to the warning being issued. The warning text says that “AT 816 PM EDT…RADAR INDICATED A SEVERE THUNDERSTORM CAPABLE OF PRODUCING A TORNADO OVER AMELIA…MOVING SOUTHEAST AT 20 MPH”, so I am assuming that they were going off of radar imagery from the TCVG radar, located at the Cincinnati/Northern Kentucky International Airport. NCDC will not release those images for a few more days, so I just posted KILN’s.
Storm Base Velocity at 8:19pm (ILN)
Storm Base Reflectivity at 8:19pm (ILN)
* The confirmed tornado in Green County occurred with neither a severe thunderstorm warning, nor a tornado warning.
** The confirmed tornado in Washington County occurred with neither a severe thunderstorm warning nor a tornado warning. The two warnings that were issued for Washington County were issued during storms that occurred on April 9th.
*** This map is made to highlight Ohio counties that have had tornado warnings issued and counties that have had confirmed tornado touchdowns in the 2015 calendar year. Shades of red indicate counties that have had tornado warnings yet have had no confirmed tornado touchdowns yet. Shades of purple indicate counties that have had confirmed tornado touchdowns. In both cases, the bright colors indicate the newest add-ons to this map and are usually the counties mentioned in the discussion above. Darker shades, on the other hand, are used for counties that have had no change in their 2015 tornado statistics. As a second feature, counties that have experienced warnings or touchdowns also have numbers coinciding to the number of tornado warnings and touchdowns. The number that follows a “W” is the number of warnings the county has received, and the number that follows the “T” is the number of confirmed touchdowns that there have been. It is important to remember that each warning issued is counted. If there is a tornado warning on a storm in Stark county, and a second warning is issued for Stark on the same storm, then Stark county would be considered to have two warnings despite there only being one tornadic storm. Likewise, if a single storm drops numerous tornadoes, each tornado will be counted as an individual tornado.
Summer has been rather busy for me, so I am late updating my map with the tornado warnings from July 13th and 14th earlier this week. I’m going to keep this one short due to the threat of severe weather later this afternoon. In total there were five tornado warnings issued; one on Monday, and the other four on Tuesday when the line of storms moved through Ohio. Clermont, Dark, Holmes, Knox, and Miami county all received tornado warnings, and these were the first tornado warnings that these counties have experienced this year. Clermont had its tornado warning on Monday, while all the rest of the counties had theirs on Tuesday.
To date, Ohio has had 6 tornadoes, and each year on average we experience 16 tornadoes (www.erh.noaa.gov) so we are having a quiet year when all things are considered. Nevertheless, there are still a few months left in our severe weather season, and we have had tornadoes in the past well into November and December.
* The confirmed tornado in Green County occurred with neither a severe thunderstorm warning, nor a tornado warning.
** The confirmed tornado in Washington County occurred with neither a severe thunderstorm warning nor a tornado warning. The two warnings that were issued for Washington County were issued during storms that occurred on April 9th.
*** This map is made to highlight Ohio counties that have had tornado warnings issued and counties that have had confirmed tornado touchdowns in the 2015 calendar year. Shades of red indicate counties that have had tornado warnings yet have had no confirmed tornado touchdowns yet. Shades of purple indicate counties that have had confirmed tornado touchdowns. In both cases, the bright colors indicate the newest add-ons to this map and are usually the counties mentioned in the discussion above. Darker shades, on the other hand, are used for counties that have had no change in their 2015 tornado statistics. As a second feature, counties that have experienced warnings or touchdowns also have numbers coinciding to the number of tornado warnings and touchdowns. The number that follows a “W” is the number of warnings the county has received, and the number that follows the “T” is the number of confirmed touchdowns that there have been. It is important to remember that each warning issued is counted. If there is a tornado warning on a storm in Stark county, and a second warning is issued for Stark on the same storm, then Stark county would be considered to have two warnings despite there only being one tornadic storm. Likewise, if a single storm drops numerous tornadoes, each tornado will be counted as an individual tornado.
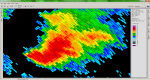
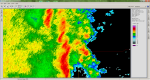
Yesterday was a busy day for the Wilmington, Ohio and Charlestown, West Virginia National Weather Service offices, for both had to issue tornado warnings as a low pressure system made its way through. Wilmington issued their 5th tornado warning of the year, which encompassed Brown, Clinton, and Highland counties (recall that Highland County just had a tornado warning this past Friday). This was the first tornado warning that Brown and Clinton counties have experienced this year, and the second one for Highland. Charlestown issued their 6th tornado warning of the year, encompassing Gallia and Lawrence counties in Ohio, giving both counties their first tornado warning for the year, as well as Cabell County in West Virginia (for the purposes of this map I will not include Cabell county on the map since it is not in Ohio). Neither of these storms produced a tornado, though Wilmington posted this impressive photograph of the mesocyclone from their warned storm on their Facebook page:
Storm Base Reflectivity at 6:00pm (ILN)
Storm Base Velocity at 6:00pm (ILN)
At 6:00pm EST, the National Weather Service in Wilmington, OH issued a tornado warning for Brown, Clinton, and Highland counties after Doppler radar indicated that the storm was capable of producing a tornado. Within about nine minutes, the tornado warning was cancelled for Brown and Clinton counties, yet remained in effect for Highland county; this due to the movement of the storm out of Brown and Clinton and into highland. Viewing the velocity images, the couplet isn’t notably strong, but the hook echo is extremely impressive.
Storm Base Reflectivity at 6:09pm (RLX)
The national weather service in Charlestown, WV issued the tornado warning for Gallia, Lawrence, and Cabell counties at 6:11pm after Doppler radar indicated that the thunderstorm was capable of producing a tornado. The reflectivity and accompanying hook echo associated with this storm is not very impressive, but I was pretty impressed by the velocity images, and therefore have posted several below. Read the captions for the time (in eastern standard time) and note that the couplet disintegrated as the cell moved from Lawrence into Gallia counties, so these images are only from Lawrence County.
The first image is the 6:09pm base velocity, which shows a well defined velocity couplet. The bright red in the middle of the bright green is an error in the radar scan; it should just be bright green. It’s a pretty strong couplet and it is pretty clear as to why they issued the warning a few minutes later at 6:11pm. The couplet basically weakened from that point on until it dissipated. Interestingly, by the 6:40 radar scan the rear-flank downdraft (RFD) begins to manifest itself as a bright green bow of high outflow winds emanating from the couplet (I drew this in the velocity images where it was relevant). These winds go on to overpower the couplet, which is evident in the 6:45pm and 6:50pm radar scans.
Storm Base Velocity at 6:09pm
Storm Base Velocity at 6:14pm
Storm Base Velocity at 6:19pm
Storm Base Velocity at 6:25pm
Storm Base Velocity at 6:30pm
Storm Base Velocity at 6:35pm
Storm Base Velocity at 6:40pm
Storm Base Velocity at 6:45pm
Storm Base Velocity at 6:50pm
* The confirmed tornado in Green County occurred with neither a severe thunderstorm warning, nor a tornado warning.
** The confirmed tornado in Washington County occurred with neither a severe thunderstorm warning nor a tornado warning. The two warnings that were issued for Washington County were issued during storms that occurred on April 9th.
*** This map is made to highlight Ohio counties that have had tornado warnings issued and counties that have had confirmed tornado touchdowns in the 2015 calendar year. Shades of red indicate counties that have had tornado warnings yet have had no confirmed tornado touchdowns yet. Shades of purple indicate counties that have had confirmed tornado touchdowns. In both cases, the bright colors indicate the newest add-ons to this map and are usually the counties mentioned in the discussion above. Darker shades, on the other hand, are used for counties that have had no change in their 2015 tornado statistics. As a second feature, counties that have experienced warnings or touchdowns also have numbers coinciding to the number of tornado warnings and touchdowns. The number that follows a “W” is the number of warnings the county has received, and the number that follows the “T” is the number of confirmed touchdowns that there have been. It is important to remember that each warning issued is counted. If there is a tornado warning on a storm in Stark county, and a second warning is issued for Stark on the same storm, then Stark county would be considered to have two warnings despite there only being one tornadic storm. Likewise, if a single storm drops numerous tornadoes, each tornado will be counted as an individual tornado.
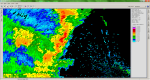
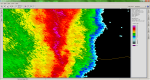
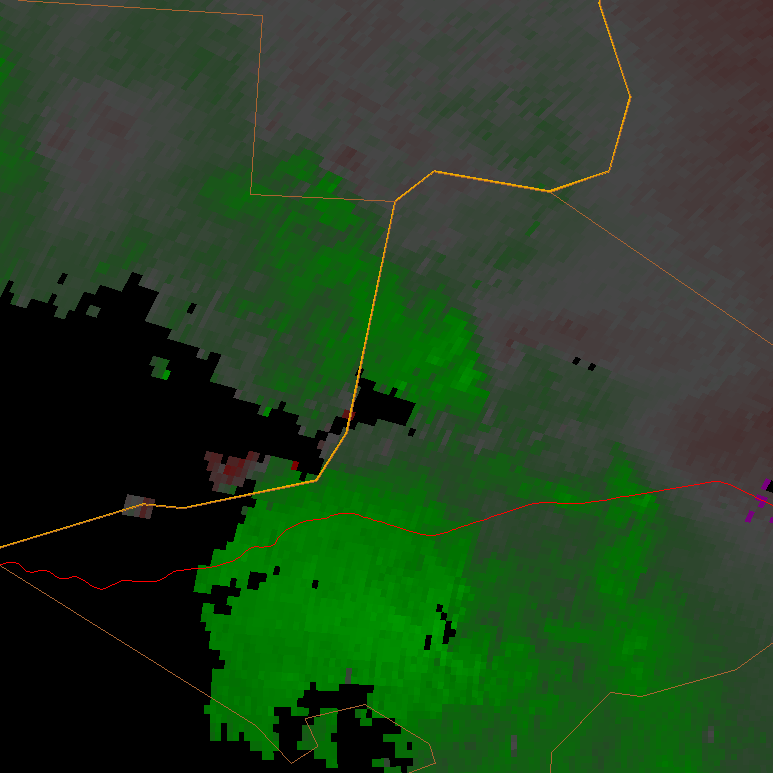
There are two more tornado warnings to be added to the map of tornado warnings and confirmed tornadoes in Ohio during the 2015 calendar year. These warnings were issued by the National Weather Service office in Wilmington, Ohio, and affected Adams, Highland, Pike, and Scioto counties. This was the first time that these four counties had received tornado warnings this year.
Storm Base Reflectivity at 3:55pm
Storm Base Velocity at 3:55pm
The first tornado warning was issued at 3:55pm for Adams, Highland, Pike, and Scioto counties. Just prior to the warning being issued, Doppler radar indicated that a region of the storm located in Highland County was capable of producing a tornado. Looking at the base reflectivity image, you can see there is a very classic hook echo present. The base velocity shows the coinciding velocity couplet which is somewhat impressive.
Storm Base Reflectivity at 4:29pm
As the storm continued to move towards the edge of the first warning polygon in Pike County, Wilmington’s Doppler radar continued to indicate that the thunderstorm could produce a tornado. The NWS issued a second warning on the storm at 4:29pm, one minute before the first warning was set to expire. This time the warning was just issued for Pike and Scioto counties, giving both of those counties their second tornado warning of the day and year.
When all said and done there were no reported tornadoes, and the worst damage, according to spotter reports, amounts to some damaged and downed trees. Therefore, the tornado count for 2015 remains at six, two fewer than last year at this time.
* The confirmed tornado in Green County occurred with neither a severe thunderstorm warning, nor a tornado warning.
** The confirmed tornado in Washington County occurred with neither a severe thunderstorm warning nor a tornado warning. The two warnings that were issued for Washington County were issued during storms that occurred on April 9th.
*** This map is made to highlight Ohio counties that have had tornado warnings issued and counties that have had confirmed tornado touchdowns in the 2015 calendar year. Shades of red indicate counties that have had tornado warnings yet have had no confirmed tornado touchdowns yet. Shades of purple indicate counties that have had confirmed tornado touchdowns. In both cases, the bright colors indicate the newest add-ons to this map and are usually the counties mentioned in the discussion above. Darker shades, on the other hand, are used for counties that have had no change in their 2015 tornado statistics. As a second feature, counties that have experienced warnings or touchdowns also have numbers coinciding to the number of tornado warnings and touchdowns. The number that follows a “W” is the number of warnings the county has received, and the number that follows the “T” is the number of confirmed touchdowns that there have been. It is important to remember that each warning issued is counted. If there is a tornado warning on a storm in Stark county, and a second warning is issued for Stark on the same storm, then Stark county would be considered to have two warnings despite there only being one tornadic storm. Likewise, if a single storm drops numerous tornadoes, each tornado will be counted as an individual tornado.
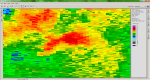
It has been a while since my last post; midterm exams and preparing for the OSU Severe Weather Symposium have kept me unusually busy. My goal in this post is to discuss the current trends of the ice cover over the Great Lakes and to begin to transition my focus solely on Lake Erie over this summer.
Figure 01: Max ice coverage that took place on 3/06/2014
Figure 02: Ice coverage as of 3/26/2014
I would like to begin with a synopsis of what the ice coverage behavior has been over the past few weeks. On March 6th, the Great Lakes reached their maximum ice coverage of 92.2% coverage, which I have displayed as Figure 01. This is due to a winter storm that affected most of the Great Lakes basin. A few posts ago I made the point that frozen precipitation combined with freezing temperatures has a greater effect on lake freezing than freezing temperatures alone. Following this storm, the lakes continued to diminish for a few weeks. This is due to the warming temperatures experienced in the Great Lakes region. The decrease in ice cover continued until March 17, at which point another round of snow hit, increasing the overall ice cover from 75.3% to 82.8%. Since then, the ice cover has been on a downward trend which still continues today, where the current ice coverage is at 74.3% coverage, which is displayed in Figure 02. I think it’s reasonable to expect that this coverage will slightly increase over the next three or four days due to the incoming cold front, but then continue to decline from here on out for three main reasons; we are progressing later into the year and are therefore have a smaller chance of seeing severe winter storms, we are about to see warm temperatures (60’s and 70’s) next week which will speed up melting, and the albedo effect will begin to play a greater role in melting.
I now wish to take a look at some graphics of various properties of Lake Erie. Since I live in Ohio and will focus mainly on Ohio weather over the summer, I plan on dedicating my focus to Lake Erie when discussing lake graphics. As long as there is ice coverage somewhere in the great lakes region, I will point that out on the GLSEA Analysis graphic, but since Lake Erie will have the greatest effect on Ohio weather during the summer, it will be my predominate focus.
Figure 04: Ice thickness over Lake Erie as of 3/26/2014
Figure 05: Ice concentration over Lake Erie as of 3/26/2014
Figures 03 and 04 display graphics of ice thickness and concentration respectively over Lake Erie. Note that the thickest and most concentrated ice occurs in western Lake Erie, west of the archipelago. This, once again, is due to the shallowness of this area. There is a region of open water that extends south and east from Point Peele (the wedge of land coming down out from Canada in northern Lake Erie). I am not entirely sure on why this is. My assumption is that a current flows past Point Peele when Lake Erie is open water, and the velocity of this current is strong enough that ice cannot form, though this assumption is probably wrong. Either way, there is a region of open water and therefore the albedo effect, the property in which dark objects absorb solar energy while light objects reflect it, will increase the rate of melting since the open water will be able to warm and melt the surrounding ice.
Figure 05: Wind velocities over Lake Erie as of 3/26/2014
Figure 06: Surface current velocity over Lake Erie as of 3/26/2014
Figure 07: Ice flow velocity over Lake Erie as of 3/26/2014
Figures 05, 06, and 07 are wind directions, surface currents, and ice velocity. I mainly included the winds because they show the existence of that low pressure system in the Northeast that has been making news lately (note the counterclockwise flow towards the eastern region of the lake). Also note the area of convergence that occurs in the middle of the lake. The chart of the Lake Erie surface currents clearly shows what regions are still covered in ice. It just as clearly shows what regions currently possess open water, for those regions will have a current velocity. Note how there is a current around Point Peele that flows from the north to the south and its speed is modeled by color. The blue areas are areas with a limited speed and are areas with a greater ice concentration. In these areas, there can still be ice movement, but because of the high ice concentration, that velocity is hindered. On the other hand, those areas where there is open water have a higher speed. Judging from these graphics, it is probable that the greatest decrease in ice cover will take place along the southern shore near Lorain county since there is essentially warm water advection taking place in that region.
A few days ago I discussed some graphics that showed the ice cover over Lake Erie. The graphic, once again displayed as figure 1 below showed that the average thickness of the ice was 34.1 cm. I went on to say that the higher temperatures we would see this week would cause significant melting of the ice. On Wednesday, I checked the GLERL website, and pulled up the graphic that I designated as figure 2 below. Keep in mind that and we were in the 40’s when I pulled that graphic, and there was still plenty of time left in the day to warm up even more. One would have expected based on temperatures alone that the ice would be really melting by now. The graphic, however, shows a much greater area of the lake covered by thicker ice and an average ice thickness of 35.7 cm. With this I ask you, why might this be the case? With the warming trend in temperatures, why might the ice have increased in thickness?
The answer is quite clear if you have been aware of the weather patterns over the Great Lakes over the past few days. There was a major snowstorm that took place over the Great Lakes Monday night, which certainly helped influence the ice cover over the Great Lakes. When making an on the fly prediction of ice coverage over the lake I did not check to see whether precipitation would fall during the period. Just goes to show that when attempting a forecast, one should definitely make sure to incorporate all the variables into their predictions.
Now, today is Thursday, and the GLCFS page has updated plots of ice thickness over Lake Erie. Already, there has been a trend of melting of ice in a lot of areas. Below I have attached graphics for data received yesterday (February 19th) and today (February 20th), and will analyze both of them. Let’s start by looking at figure 3.
This graphic shows ice thickness over Lake Erie on February 19. Notice that the area of the lake covered by ice 30 cm thick has greatly expanded (this is that light gray that extends for most of the area between the two dark regions). If you are having trouble understanding how to interpret what the colors mean, look at the labels of the contours. In general, most of the areas of thicker ice have greatly expanded between the February 18th run and the February 19th run, but notice that melting is now evident in a few areas, namely along the Ohio coast between Cedar Point and Ashtabula, and more noticeably along the coast of the Lake Erie archipelago. Once again, remember that this graph does not account for ridging, rafting, or brash ice, and therefore ice may still be present in these regions. Now that there are small yet noticeable areas of open water, the albedo effect should be able to run its course and speed up warming. That being said, let us look at figure 4 below.
This graphic shows ice coverage today (February 21st). Note that by now we have had two days with temperatures in the mid to upper 40’s, and yet the region discussed above that was 30 cm thick now has regions that have increased in thickness to 35 cm thick. This is most likely caused by today’s morning precipitation and low temperatures. Notice that the small open regions of thin ice on the February 19th graphic have opened up even more now, and the ice along Lake Erie’s northern coast is now thinning out. This precipitation that thickened some regions of the lake should move out this morning, and the warm air advecting in due to the incoming low should be enough to create some open expanses of open water today. Due to the temperature drop also associated with the low, the ice will subsequently begin to thicken again.
Again, these graphics were taken from the Great Lakes Environmental Research Laboratory, and can be found by navigating around their page at: